ECFG21/LF201/LF101 Applications
|
 Electrofusion (Electro Cell Fusion) Electrofusion (Electro Cell Fusion)Electrofusion was performed using the LF201 Electro Cell Fusion Generator (Nepa Gene, Japan) and the CUY497P2 MS Stand Model Chamber Type Platinum Electrode, L80mm x W2mm x H5mm, 0.8ml (Nepa Gene, Japan), (Fig. 1). The electrofusion buffer was composed of 0.3M mannitol, 0.1mM calcium chloride and 0.1mM magnesium chloride.
|
|||||||
| Table1 Comparison of fusion methods using mouse iliac lymph node lymphocytes
  |
Comparison of methods using PEG and electrofusion Experiments using PEG and electrofusion were done with iliac lymph node lymphocytes from mice. The cells in two cryogenic vials were thawed and mixed (approx. 4 x 10⁷ cells). Then half of the cells were fused by PEG and the other half of the cells were fused by electrofusion. This set of experiments was done three times. The result was that the number of positive wells by electrofusion was 1.5-4.0 times as many as by PEG (Table 1). The average rate was 2.8 times. Discussion of electrofusion Cell fusion with PEG, electrofusion and HVJ-E was done using iliac lymph node lymphocytes from rats (Fig. 2 and 3). Cell fusion by electrofusion can be done with smaller number of lymphocytes than by PEG and HVJ-E, and its operation time is shorter than PEG and HVJ-E. The growth of fused cells after electrofusion was faster because its damage seemed to be low. Therefore ELISA screening for positive wells by electrofusion was done one day earlier than by PEG. The fusion technique does not vary from individual to individual because electrofusion operation is simple. Once the fusion operation and electric setting are optimized, the fusion with the equal condition can be always generated for the same animal's lymphocytes. The fusion with an equal condition leads to small variation in the data. With electrofusion, the fusion time is short, the cell damage is low and the fusion efficiency is the highest. At this experiment, the number of positive wells was 6 times better compared to PEG. |
|||||||||||||||||
|
Summary 3 kinds of cell fusion methods were compared using iliac lymph node lymphocytes from mice and rats. PEG method is economical but the result varies according to fusion. The fusion efficiency by HVJ-E is the same or higher than PEG but it is better than PEG in that fused cells grow vigorously. The fusion efficiency by electrofusion is approx. 6 times better in the use of rat lymphocytes and approx. 3 times better in the use of mouse lymphocytes as high as by PEG. Electrofusion method is clearly the best out of the three in terms of efficiency, reproducibility, time and cost. |
||||||||||||||||||
Satoko Inoue and Yoshikazu Sado, |
|
|||
 |
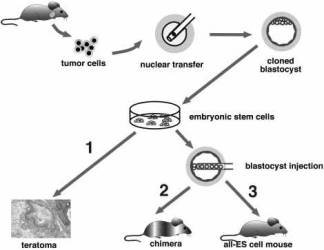
Fig. 1. Two-step cloning procedure to produce mice from cancer cells. Different tumor cells were used as donors for nuclear transfer into enucleated oocytes. Resultant blastocysts were explanted in culture to produce ES cell lines. The tumorigenic and differentiation potential of these ES cells was assayed in vitro by inducing teratomas in SCID mice (1), and in vivo by injecting cells into diploid (2) or tetraploid (3) blastocysts to generate chimeras and entirely ES-cell-derived mice, respectively. |
|
|
|
||
 |
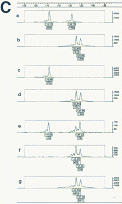
Fig. 2. Analysis of the developmental potential of R545-1 ES cells. (a) A hatching blastocyst derived from a breast cancer cell by nuclear transfer shows a blastocoel cavity, trophectoderm layer, and an inner cell mass. (b,c) H&E staining of teratoma sections produced from R545-1 ES cells shows differentiation into mature neurons, mesenchymal cells, and squamous epithelium (b), and columnar epithelium, chondrocytes, and adipocytes(c). (d–f) Contribution of GFP-labeled R545-1 ES cells to newborn chimeras. Shown on top are the GFP images of the head (d), heart (e), and intestine (f) of one chimera. Below are the same images under phase contrast. (g) FACS analysis of peripheral blood of a Rag2/R545-1 ES cell chimera shows the presence of B cells using antibodies FITC-IgM/PE-B220 and T cells using antibodies FITC-CD4/PE-CD8. (h) Contribution of R545-1 cells to the skin indicates differentiation into melanocytes. Arrows depict spontaneous development of tumors on the eye and neck of chimera. (i) Embryos produced entirely from ES cells by tetraploid complementation develop to E9.5 with obvious tail and limb buds, a closed neural tube, and a beating heart. |
|
|
|
||
 |
Fig. 3. Cancer phenotype in chimeric mice. (a) Comparison of the average latency period of tumor development in the melanoma donor mice (top) with that in nuclear transfer (NT) chimeras (bottom). Note the similar latency of tumor development in NT chimeras with that in donor mice after readministration of doxycycline (recurrent tumors). (b–d) Representative pictures and immunohistochemistry of tumors that formed in R545-1 NT chimeras. Arrows indicate sites of tumor growth. Melanomas (b), a rhabdomyosarcoma (c), and a malignant peripheral nerve sheath tumor (MPNST; d) were identified by H&E staining and immunohistochemistry with melanocyte-specific TRP-1 or muscle-specific desmin or MPNST-detecting GFAP and S-100 antibodies, respectively. |
|
 |
||
Hochedlinger K et al., |
||
|
|
|||||||||||
Fig. 1. Electrofusion of droplets in the fusion chamber.
|
|||||||||||
 |
| Fig. 2. High speed camera images of the fusion process. This fusion process is almost instantaneous. The two droplets combined into one single ''peanut-shaped'' droplet within about 1ms. It took about another 5ms for the droplet to adopt a spherical shape under the effect of surface tension. Throughout the fusion process, the darker colored blue ink droplet (leftmost) was distinctly separated from the lighter colored water droplet (rightmost). |
Wei-Heong Tan and Shoji Takeuchi, CIRMM/IIS, Institute of Industrial Science, University of Tokyo |
|
 |
|
||||||||
 |
Fig. 2. Experimental sequence of liposome fusion (1) Alignment, (2) Membrane breakdown, (3) Reconnection Illustrates a real sequence of liposome fusion from the alignment of vesicles to the membrane reconnection subsequent to their breakdown. |
 |
Fig. 3. Electrofusion of E. coli provacuoles with bulk electrodes (a) Alignment, (b) After fusion The conditions of electrofusion were similar to liposome's ones except for more (20) and longer (90 |
Guillaume Tresset 1 and Shoji Takeuchi 2 1 LIMMS/CNRS-IIS, 2 CIRMM/IIS, Institute of Industrial Science, University of Tokyo |
|
| Fig. 1. Photographs of calves obtained after nuclear transfer. | ||||||||
|
After insertion of donor ES-like cells into the perivitelline space of oocytes, cells and cytoplasts were fused electrically in fusion medium. (DC: 20V, Pulse length: 50 |
|||||||
|
||||||||||||
|
||||||||||||
|
|
Dr. Shigeo Saito, Saito Laboratory of Cell Technology |


